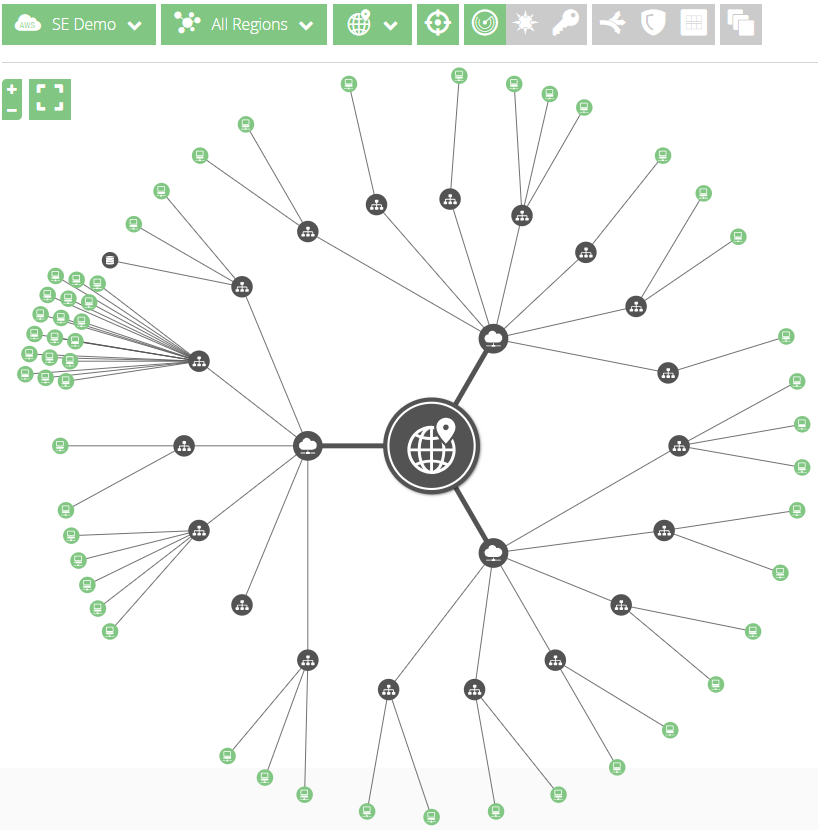
Topology
The Topology page displays an interactive diagram that uses color-coded icons to show the distribution of exposures and threats across your network assets.
Topology allows you to select regions or assets to see details about the item, exposures, and remediations for those exposures.
Access the Topology page in the Alert Logic console under the Overview tab, by clicking the Topology subheading.
Topology page views
The Topology page menu bar allows you to specify the deployment, region, and grouping of the assets displayed in the diagram, how the assets are displayed, and the status of those assets.

Specify deployments, regions, and grouping
The Topology page menu bar allows you to change the selected deployment, region, and the grouping of assets.
Specify a deployment
Some workflows require you to view the topology diagram of more than one deployment. Use the Deployment drop-down menu to switch the displayed topology diagram to that of another deployment.
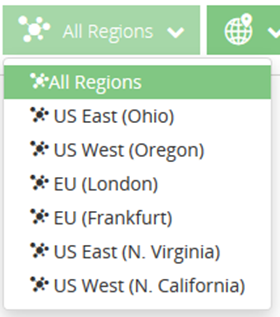
Specify a region
By default, the displayed topology diagram includes all regions in the selected deployment. If your deployment includes multiple regions, you can click the Regions drop-down menu to specify a single region for a more focused view of deployment assets.
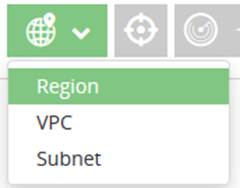
Group by
By default, the topology diagram groups assets by region. If needed, you can click the Group by drop-down menu to specify whether you want to change the grouping of regional assets to VPC or subnet.
Customize the diagram display
By default, the topology diagram displays regions and their VPCs, subnets, and instances. The Alert Logic console allows you to customize your view of the topology diagram.
-
 Scope — Click Scope to only includey assets within the deployment scope in the topology diagram.
 -
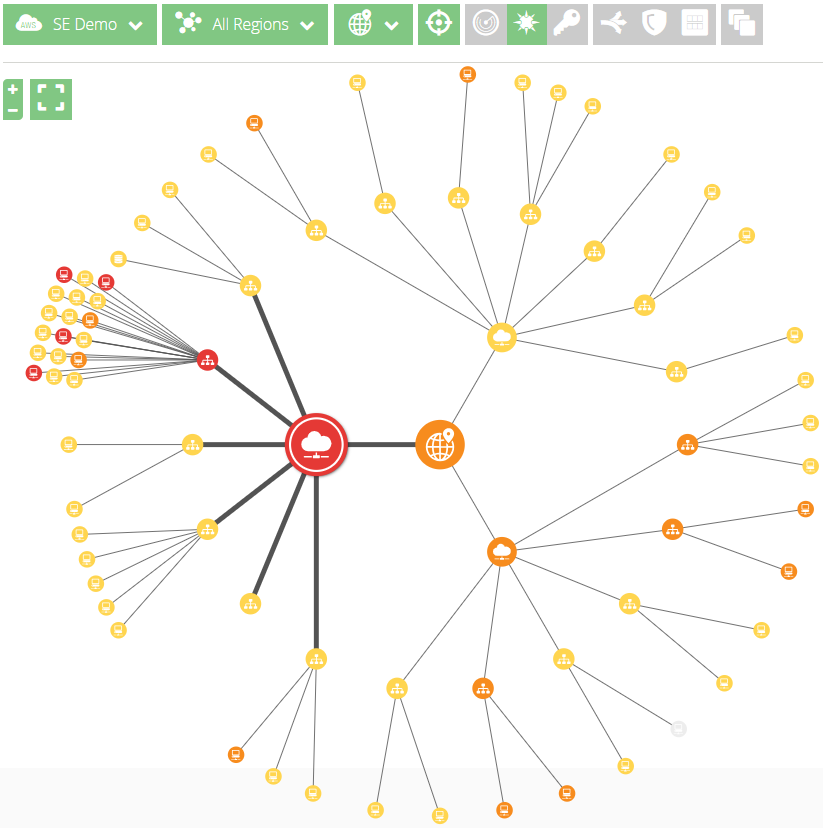
 Scan map — Click Scan map to display the diagram as a scan map in which asset icons appear in colors that identify their scan states. Color codes for scan states are as follows:
 Green: Scanned
 Dark gray with a green halo: Currently being scanned
 Dark gray: Not scanned
 Light gray: Not in scope
-
 Threat map — Click Threat map to display the topology diagram as a threat map in which asset icons appear in the color that identifies their threat levels. Color codes for threat levels are as follows:
 Red: High
 Yellow: Medium
 Gray: Low
-
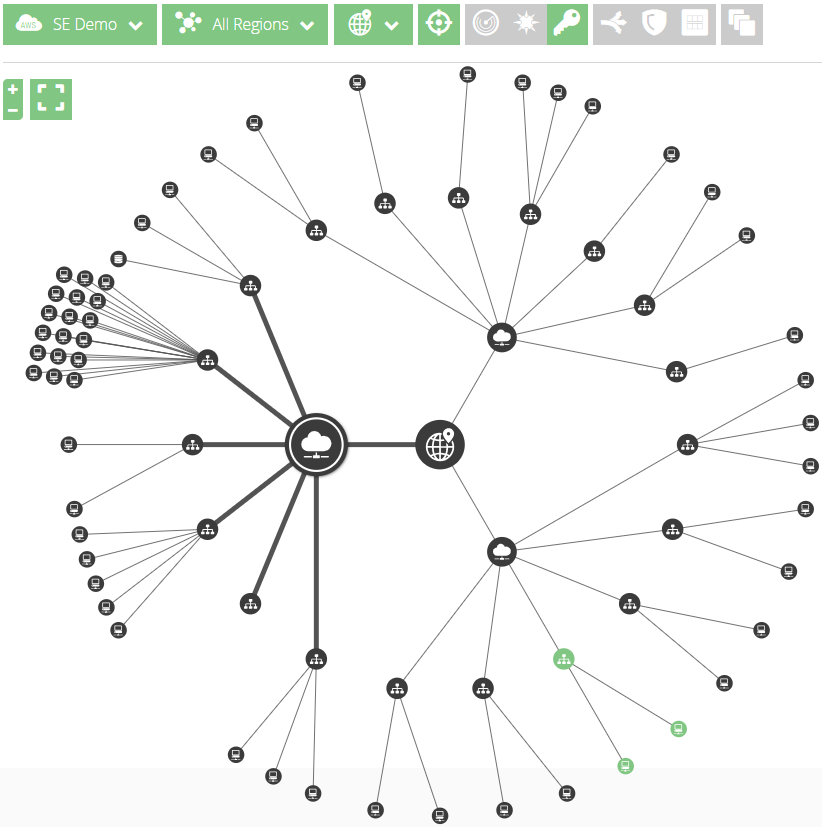
 Credentials map — Click Credentials map to display the topology diagram as a credentials map in which assets with assigned credentials are highlighted in green.
Add assets to view
You can add the following assets to the topology diagram:
-
 Load balancers
 -
 Security groups
 -
 AMIs
AMIs -
 Stopped instances
Whitelist trusted hosts
The Whitelist feature allows you to exclude trusted hosts from scans. The whitelist only scans the assets you need to monitor for exposures, and the Remediations page only displays the more relevant remediations.
The Whitelist feature requires you to set up AWS tags for your assets. For more information about AWS tags, see the AWS documentation, Working with Tag Editor.
To add a tagged asset to the Cloud Insight Whitelist:
- On the Topology menu bar, click the Whitelist icon (
 ).
). - In the search bar, type the name of the AWS tag for the asset you want to add to the whitelist.
As you type a tag name, the console displays a list of tags from which you can select the correct tag. Cloud Insight automatically fills the key and value fields.
- Click add to list.
Search for specific assets
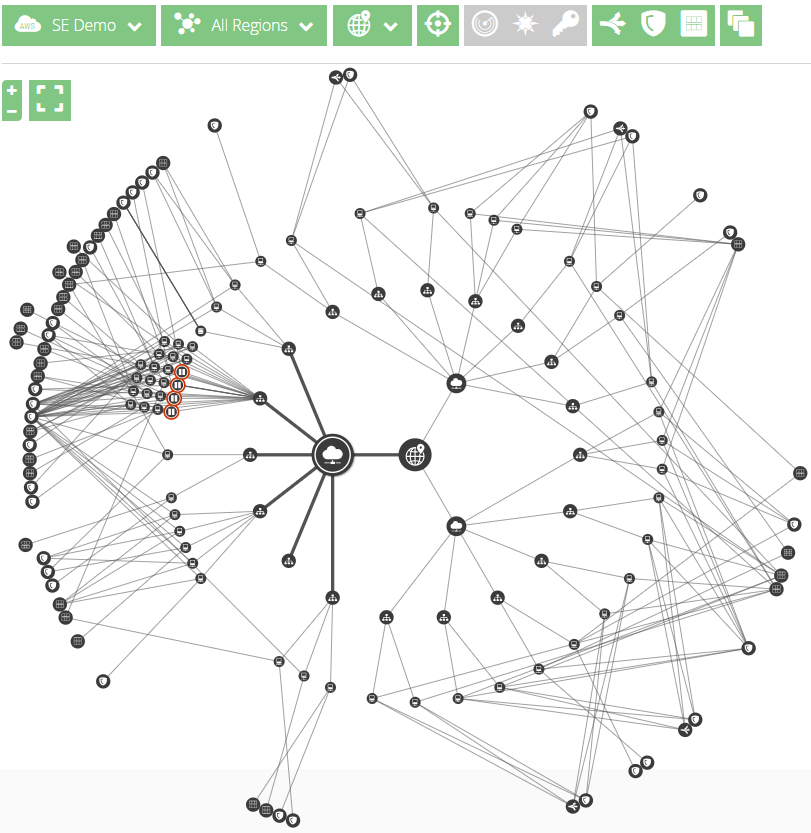
If a selected deployment includes a detailed Topology diagram with a large number of assets, you can use the search asset field to easily find specific assets.
In the search asset field, type all or part of the following:
- Asset name
- Asset type
- Key name
- VPC ID
- Instance ID
The search bar displays the number of assets that match your search criteria, and those assets appear highlighted in the Topology diagram. Click a highlighted asset to view its details.
Asset details
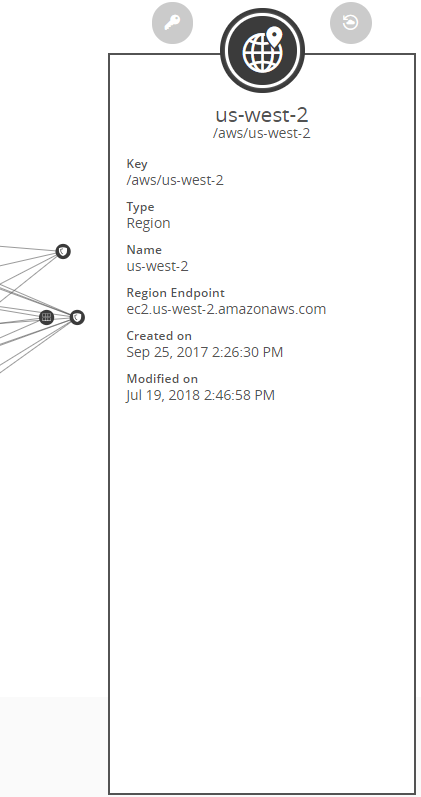
Click a region, VPC, subnet, or host to manage its credentials, view its info, view recommended remediations for the asset, or add the asset to the Watch List Assets tab on the slide-out message panel.
Add or manage asset credentials
Alert Logic uses credentials to gather information about the assets in your environment. Click a region, VPC, or subnet, and then click the Credentials icon (![]() ) to manage the region or asset credentials. For more information about configuration of asset credentials, see Set up authenticated scanning in "Get Started with Cloud Insight and Cloud Insight Essentials."
) to manage the region or asset credentials. For more information about configuration of asset credentials, see Set up authenticated scanning in "Get Started with Cloud Insight and Cloud Insight Essentials."
Remediate issues or add an asset to the Watch List
Click a region or asset, and then click the Remediate icon (![]() ) to see the recommended remediations, or to add the selected asset to the Watch List Assets tab on the Cloud Insight slide out message panel. Use the watch list to monitor selected assets for changes in threat levels.
) to see the recommended remediations, or to add the selected asset to the Watch List Assets tab on the Cloud Insight slide out message panel. Use the watch list to monitor selected assets for changes in threat levels.